
27. Static Properties Of Prestressing Steel (Prestressed Concrete)#
List of symbols:
\(\begin{array}{ll}E_{p} &= \text { modulus of elasticity}\\ E_{p}{ }^{\prime} &= \text { tangent to the stress-strain curve at the proof stress} ~\sigma_{p}\\ f_{p} &= \text { tensile strength}\\ f_{p 0.1} &= \text { 0.1 \% proof stress}\\ f_{p 0.2} &= \text { 0.2 \% proof stress}\\ f_{p p} &= \text { proportional limit}\\ f_{p y} &= \text { yield stress}\\ m &= \text { parameter of the second part of the modified Ramberg-Osgood curve}\\ n &= \text { parameter of the Ramberg-Osgood curve}\\ n^{\prime} &= \text { parameter of the first part of the modified Ramberg-Osgood curve}\\ p &= \text { plastic strain at the proof stress} ~\sigma_{p}\\ P &= \text { prestressing force}\\ P_{0} &= \text { jacking force}\\ \Delta P &= \text { prestress losses}\\ t &= \text { time}\\ x &= \text { distance from the jacking end}\\ \varepsilon &= \text { strain}\\ \varepsilon_{p} &= \text { full strain at the proof stress} ~\sigma_{p}\\ \varepsilon_{u} &= \text { strain corresponding to the tensile strength}\\ \sigma &= \text { stress}\\ \sigma_{p} &= \text { proof stress}\end{array}\)
27.1. Types of prestressing steel#
Three types of steel are used as prestressing tendons in concrete structures:
cold drawn wires;
strands - consist of a number of cold drawn wires spun together in helical configuration, most commonly used are 3-wire and 7-wire strands;
high-strength bars.
More detailed description and requirements to steel products used in prestressing tendons in different countries may be found in appropriate standards (e.g., EN 10138 [27.01]).
27.2. Stress-strain relationship#
A typical stress-strain diagram of prestressing steel in uniaxial tension is shown in Fig. 27.1.
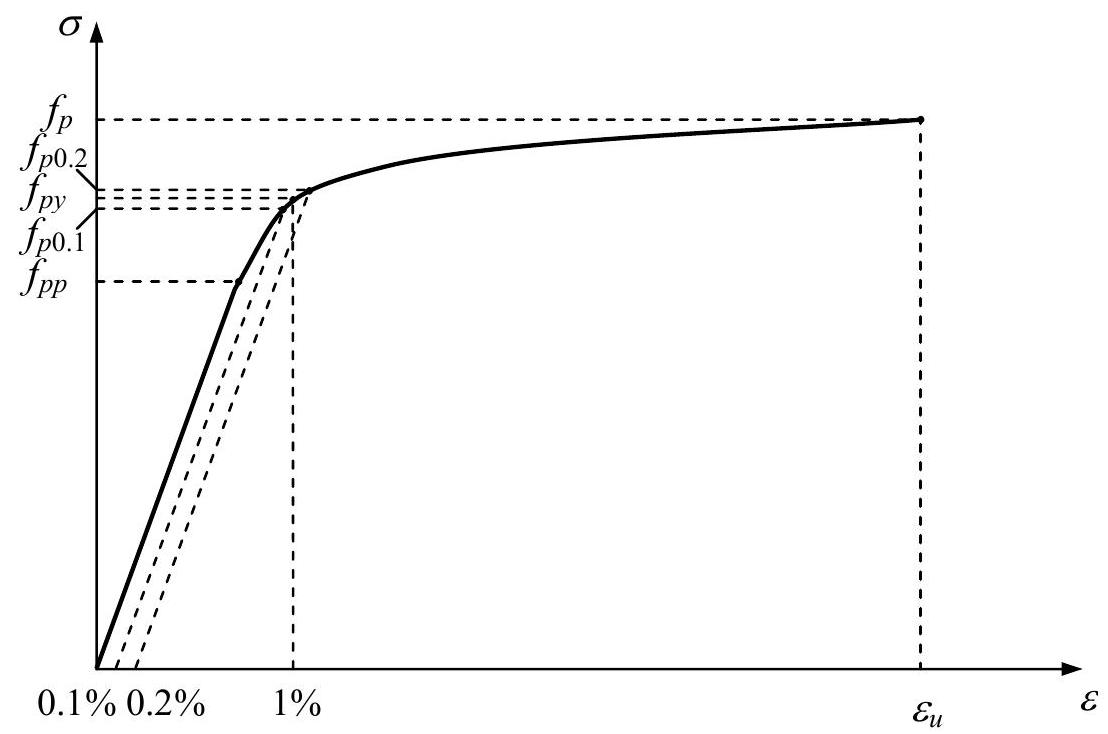
Fig. 27.1 Typical stress-strain diagram of prestressing steel#
As it can be seen from the diagram, prestressing steels do not have a distinct yield point, so that their yield stress is determined according to a strain criterion. Depending on the standard, yield stress, \(f_{p y}\), can be defined as the stress at the \(0.1 \%\) offset, \(f_{p 0.1}\) (which can also referred to as \(0.1 \%\) proof stress [27.01]), as the stress at the \(0.2 \%\) offset, \(f_{p 0.2}\) (or \(0.2 \%\) proof stress) [27.02], or according to ASTM standards [27.03] as the stress that corresponds to a total strain of \(1 \%\) for wires and strands and of \(0.75 \%\) for prestressing bars.
Other important parameters of the stress-strain diagram are:
the modulus of elasticity, \(E_{p}\);
the proportional limit, \(f_{p p}\), which is usually determined as the stress at the \(0.01 \%\) (or \(0.02 \%\) ) offset;
the tensile strength, \(f_{p}\), and
the elongation at maximum load, \(\varepsilon_{u}\).
Only probabilistic models of these parameters of the stress-strain diagram are considered in the following.
For calculations where an analytical description of the stress-strain diagram is needed, it can be represented by the Ramberg-Osgood curve [27.04] defined in terms of three parameters - the initial modulus of elasticity, \(E_{p}\), a proof stress, \(\sigma_{p}\), and a parameter \(n\) defining the sharpness of the knee of the stress-strain diagram
where \(p\) is the plastic strain corresponding to \(\sigma_{p}\). The proof stress is usually chosen as the \(0.1 \%\) (i.e., \(\sigma_{p}=f_{p 0.1}\) ) or \(0.2 \%\) (i.e., \(\sigma_{p}=f_{p 0.2}\) ) proof stress and the corresponding values of \(p\) are 0.001 and 0.002 , respectively. The probabilistic models of \(E_{p}, f_{p 0.1}\) and \(f_{p 0.2}\) are presented in the following, while the parameter \(n\) can be determined by requiring that the Ramberg-Osgood curve passes through the ultimate point \(\left(\varepsilon_{u}, f_{p}\right)\)
However, when \(n\) is determined using Eq. (27.2) the Ramberg-Osgood curve may noticeably deviate from measured stress-strain diagrams, especially for stresses between \(f_{p p}\) and \(\sigma_{p}\). A better approximation may be achieved by using a modified Ramberg-Osgood curve consisting of two parts [27.05]
where \(\varepsilon_{p}\) and \(E_{p}\) ‘are the strain and tangent to the stress-strain curve at \(\sigma_{p}\), and \(m\) is a parameter which determines the shape of the stress-strain curve in the range \(\sigma_{p} \leq \sigma \leq f_{p}\). The parameter \(n\) ‘for the first part is determined based on the \(0.01 \%\left(f_{p p}\right)\) and \(\sigma_{p}\) proof stresses that leads to the following formula
The parameters of the second part are estimated as
27.3. Probabilistic model#
Variability of the mechanical properties of prestressing steel is presented by the following independent \({ }^{1}\) random variables: \(f_{p}, E_{p}\) and \(\varepsilon_{u}\). Statistical parameters of these random variables are given in Table 27.1, where \(f_{p k}\) is the characteristic (nominal) tensile strength of prestressing steel which usually denotes the steel grade.
Variable |
Mean |
Std. dev. |
COV |
Distribution |
Reference |
|---|---|---|---|---|---|
\(f_{p}\) |
1.04 \(f_{p k}\) |
- |
0.025 |
Normal |
|
\(E_p\) |
200 GPa – for wires |
- |
0.02 |
Normal |
[27.06] |
\(\varepsilon_u\) |
0.05 |
0.0035 |
- |
Normal |
[27.06] |
According to available experimental data [27.06] there is strong correlation between the tensile strength \(f_{p}\) and the other stresses that characterise the stress-strain diagram (i.e., \(f_{p p}, f_{p y}\), etc.). Thus, these stresses can be expressed via \(f_{p}\). The relation between the stresses and \(f_{p}\) can be obtained from information provided by the steel supplier, or if such information is not available, data given in Table 27.2 can be used (see [27.08]-[27.09]).
Steel type |
\(f_{p p}\) |
\(f_{p 0.1}\) |
\(f_{p 0.2}\) |
\(f_{p \mathrm{y}}\) (at 1% total strain) |
|---|---|---|---|---|
Wire |
0.70 \(f_{p}\) |
0.86 \(f_{p}\) |
0.90 \(f_{p}\) |
0.85 \(f_{p}\) |
Strand |
0.65 \(f_{p}\) |
0.85 \(f_{p}\) |
0.90 \(f_{p}\) |
0.85 \(f_{p}\) |
Bar |
0.85 \(f_{p}\) |
27.4. Bundles of tendons#
A bundle is formed of tendons (wires or strands) laid together in parallel. Although prestressing steels do not show distinct yielding relatively flat and long hardening part of the stress-strain diagram allows to assume that the tensile strength of a bundle of tendons equals to the sum of the strengths of the individual tendons in the bundle (i.e., full plasticity model). If there are no data about correlation between the tensile strengths of individual tendons in a bundle, between tendons that are not parts of a same bundle, etc., full correlation between the tensile strengths of individual tendons can be assumed.
27.5. Prestressing force#
The effect of prestress on structural concrete is often considered as a prestressing force applied to the concrete. A prestressing force \(P(x, t)\) at a distance \(x\) from the active (i.e., jacking) end at a time \(t\) can be expressed as
where \(P_{0}\) is the jacking force and \(\Delta P(x, t)\) losses of prestress. The losses depend on a number of factors such as the type of prestress (i.e., internal or external, pretensioning or post-tensioning, bonded or unbonded), properties of prestressing steel and concrete, environmental conditions, etc. Due to multiplicity of these factors and interrelation existing between some of them an exact analytical determination of \(\Delta P(x, t)\) is not possible and different design codes provide different empirical models to estimate the losses.
In practice it is usually necessary to consider the values of prestressing force at two times:
The prestressing force applied to the concrete at the time \(`t=t_{0}\) immediately after transfer
where \(\Delta P\left(x, t_{0}\right)\) is the immediate loss which (depending on the type of prestress) includes losses due to elastic shortening of concrete, friction, short-term relaxation of prestressing steel and anchorage slip.
The effective (or long-term) prestressing force applied to the concrete at the time \(t=\infty\), i.e., after losses have stabilised
where \(\Delta P(x, \infty)\) is the time-dependent (or deferred) loss which includes losses due to creep and shrinkage of concrete and long-term relaxation of prestressing steel.
Normally, jacks used for prestressing are regularly calibrated that ensures good control over the jacking force\(P_{0}\). Variability of \(P_{0}\) can be estimated using data from the equipment producer and equipment calibration. Uncertainty associated with the evaluation of the prestressing force will depend on uncertainty of models used to estimate prestress losses and variability of parameters employed in these models. Currently, no sufficient statistical data are available to quantify uncertainties of the prestress losses models and of the parameters associated with the models (e.g., [27.010]).
For typical situations the mean values of prestress losses can be estimated in accordance with models provided in design codes and in absence of more specific data COVs of given in Table 27.3 can be used (Note: these COVs are based on data for internal bonded tendons). Prestress losses can be treated as normal random variables. For typical magnitudes of prestress losses the corresponding COVs of prestressing forces have been estimated and their values are also presented in Table 27.3 (Note: these values are in good agreement with the assessments presented in [27.011]).
Parameter |
COV |
COV |
|---|---|---|
Immediate, \(t=t_{0}\) |
Long-term, \(t=\infty\) |
|
Prestress losses, \(\Delta P(x, t)\) |
0.3 |
0.3 |
Prestressing force, \(P(x, t)\) |
0.04 - 0.06 |
0.06 - 0.09 |
For a bundle of tendons prestress losses are considered for the whole bundle, i.e., there is full correlation between prestress losses in different tendons of the bundle. Full correlation can be also assumed between prestress losses in tendons of the same bundle at different distances from the active end, i.e., \(\Delta P\left(x_{1}, t\right)\) and \(\Delta P\left(x_{2}, t\right)\) are fully correlated [27.010].
References
Standards Australia. Steel wire for tendons in prestressed concrete. Standards Australia, n.d.
American Society for Testing and Materials. Uncoated stress-relieved steel wire for prestressed concrete and uncoated high-strength steel bar for prestressing concrete. American Society for Testing and Materials, Philadelphia, n.d.
W. Ramberg and W.R. Osgood. Description of stress-strain curves by three parameters. Technical Note 902, NACA, 1943.
K.J.R. Rasmussen. Full stress-strain curves for stainless steel alloys. Research Report R811, Department of Civil Engineering, University of Sydney, 2001.
S.A. Mirza, D.K. Kikuchi, and J.G. MacGregor. Flexural strength reduction factor for bonded prestressed concrete beams. ACI Journal, 77(4):237–246, 1980.
FIP Commission on Prestressing Steels and Systems. Report on prestressing steels: types and properties. FIP, Wexham Spring, England, 1976.
CEN. Eurocode 2: design of concrete structures. part 1: general rules and rules for buildings. CEN, Brussels, n.d.
Bulletin D’Information No. 213/214. Ceb-fip model code 1990 (ceb-fip mc90). Lausanne, Switzerland, n.d.
H. Mathieu. Reliability problems associated with prestress. In: Bulletin D’Information No. 202: Reliability of Concrete Structures. CEB, Lausanne, Switzerland, 1991.
A.E. Naaman and A. Siriaksorn. Reliability of partially prestressed concrete beams at serviceability limit states. PCI Journal, 27(6):66–85, 1982.